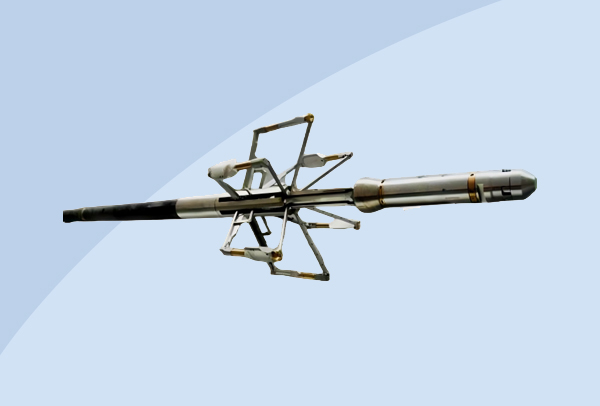
Product Name:MRIT Micro-resistivity Scanning Imaging Logging Tool
|
Type:
|
|
|
producer:
|
|
|
Description:
|
In nowday’s oil exploration field, thorough and effective reservoir evaluation is more important than ever before. The extended Micro-Resistivity Scanning Imaging Logging Tool (MRIT) is a new tool designed to provide a clear and intuitionistic image of stratum around borehole wall.
|
Tool IntroductionWorking PrincipleTool CharacteristicsTechnical specificationsGeological Application
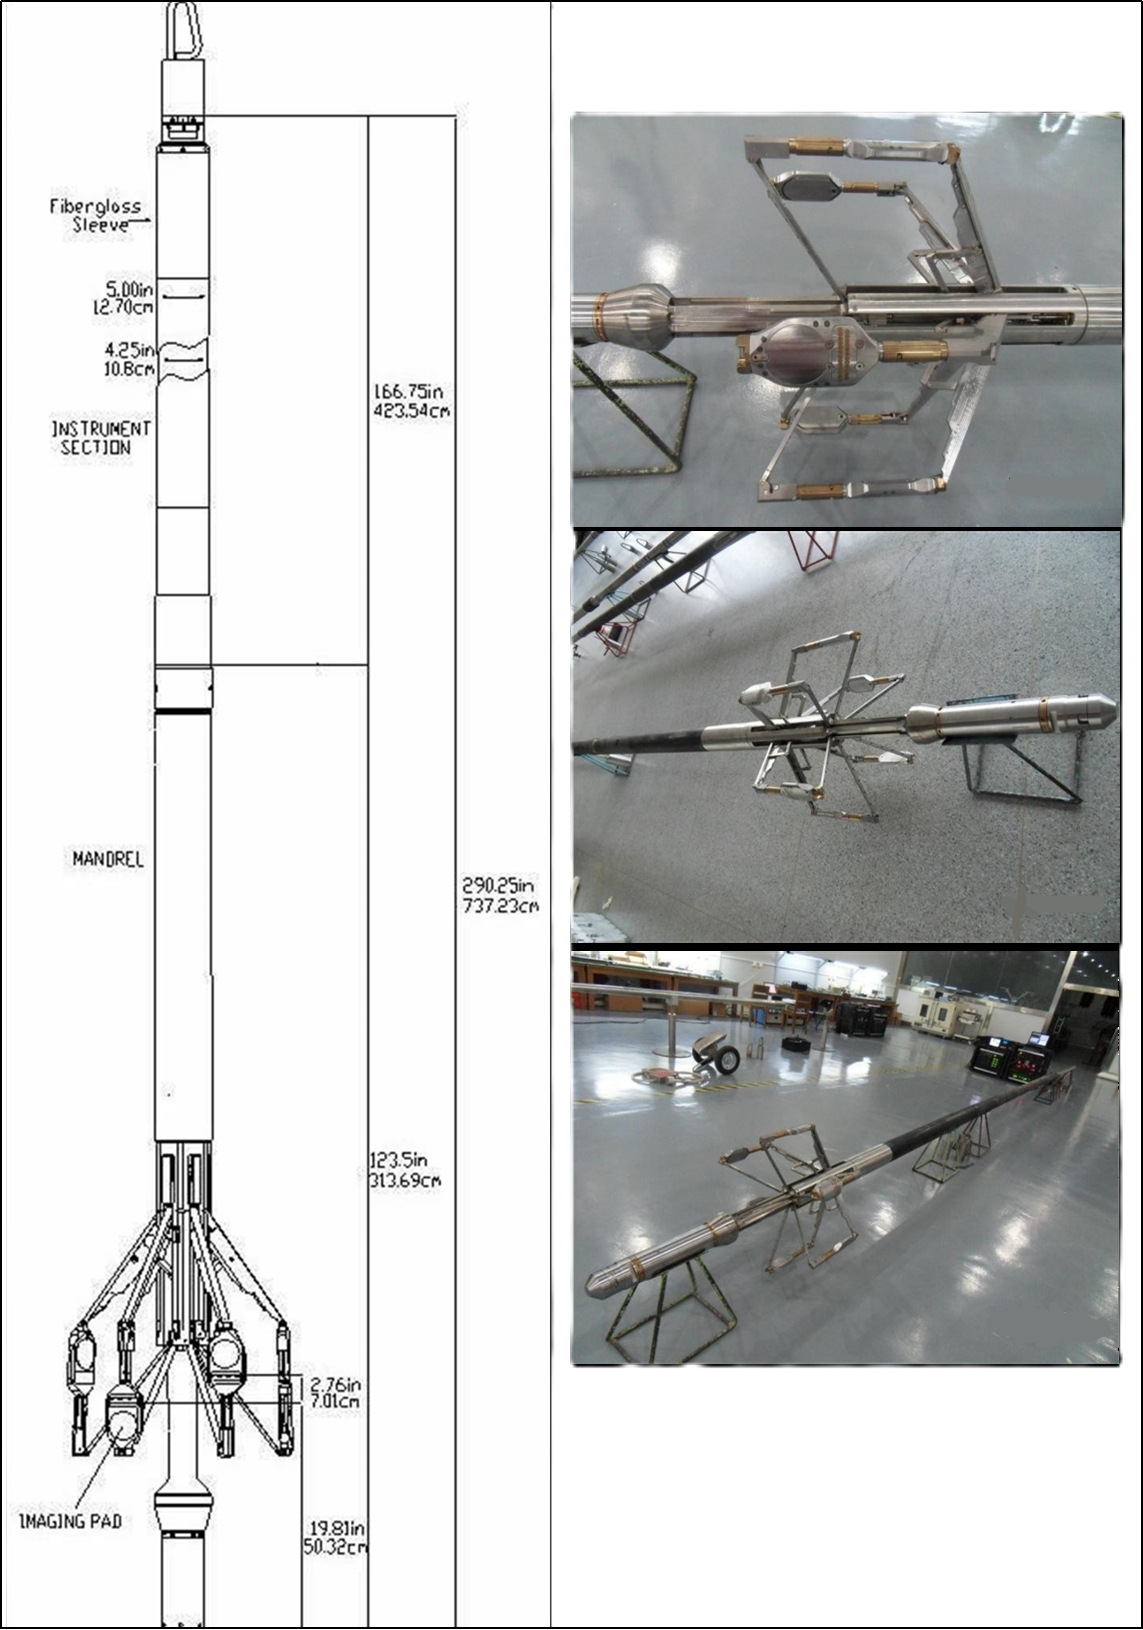
In nowday’s oil exploration field, thorough and effective reservoir evaluation is more important than ever before. The extended Micro-Resistivity Scanning Imaging Logging Tool (MRIT) is a new tool designed to provide a clear and intuitionistic image of stratum around borehole wall. Based on the Six-Arm Dipmeter (SED) technology, the 6 pads of MRIT are each mounted on an independent arm (6 in all), allowing improved electrode- to-formation contact. High quality formation resistivity data are achieved by using 150 pad-mounted button electrodes distributed at 25 per pad. This finally produces tool location data, six micro-resistivity curves and six independent caliper curves with a measurement resolution of 0.2 inch.
Calibration And Verification

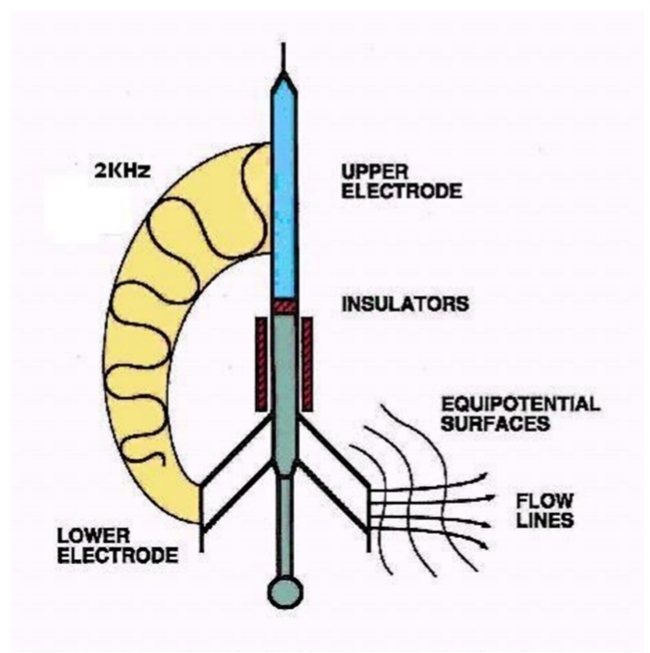
MRIT is a non-focus electric logging tool. The tool current loop goes from lower button electrode on pad into formation, then comes back to upper electrode. In fact, the housing of cartridge acts as upper electrode.In the logging process, the pads are forced to contact against the borehole wall by the motor-drive mechanical push-and-pull system. Then the logging software controls emitting current upon measured value, and the current and potential difference measurements on each button electrode meanwhile are recorded, presenting the micro-resistivity variation within the formation around the borehole.
The tool resolution is closely related with the pad-mounted button electrodes arrangement. MRIT takes such a array shown in the following diagram, by which 0.2 in. (5mm) of both the all-around resolution and vertical resolution and 80% coverage of a 6.5 in. hole can be achieved when the tool works at the MAX investigation speed of 1800ft/h.
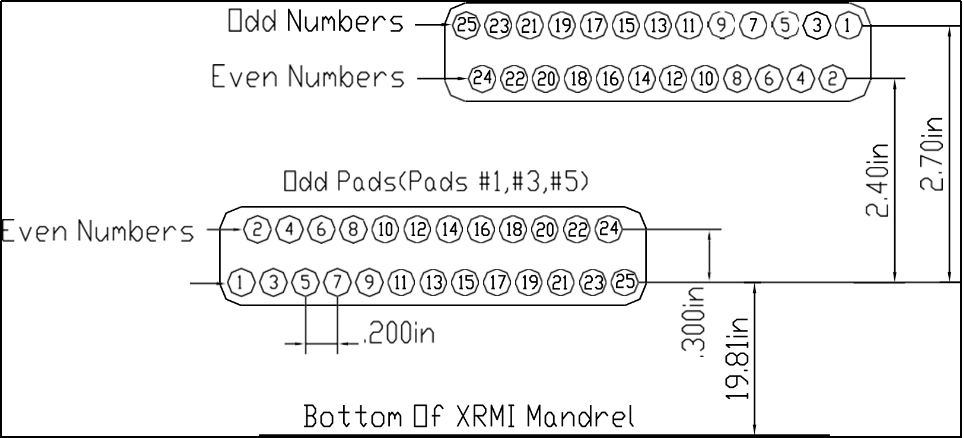
Pad Buttons Arrangement Diagram
MRIT takes the advanced design concept of digitalized pad so as to greatly enhance the image quality and the measurement range. With the sample signals digitalized in the pad, the button electrode enables serial digital communication with electric circuit. As a result, the coupling jam among signal lines is reduced and the signal to noise ratio is improved, which is beneficial for minor signal acquisition.
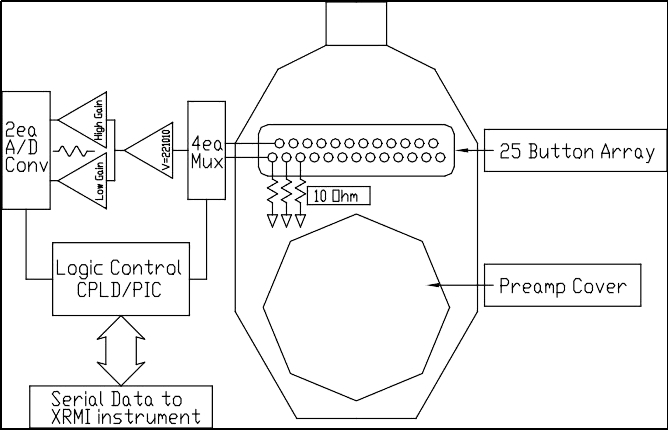
MRIT Pad Functional Diagram
Dimensions and nominal values |
MAX temperature: 175 ℃ | MAX pressure: 140MPa |
Tool OD: 5 in (12.7 cm) | Min hole size: 5.875in ( 14.92cm ) |
Overall length of tool: 24.18ft ( 7.69m ) | MAX well size: 21 in (53.34 cm) |
Tool Weight: 496 lb (97.5 kg) |
|
Hole environment |
Hole fluid: salt water ■ fresh water ■ oil □ gas □ |
Logging speed: High data rate 30ft/min (9.1m/min) imaging mode Low data rate 20ft/min (6.1m/min) imaging mode |
Hardware Specifications |
Source Type: Inductive Current |
Sensor type: Button electrode |
Sensor spacing: two rows, 12 sensors in one row, 13 sensors in one row Row spacing: 0.3 in Horizontal spacing of each row of sensors: 0.2 in Two rows of overlapping sensors: 0.1 in |
Sampling frequency: 120 samples/ft (394 samples/m) 20ft/min ( low data rate) & 30ft/min (high data rate) |
Composability: DITS compatible, bottom only 310 words/frame ( low data rate) / 456 words/frame (high data rate) |
Measurement data |
| resistance | Azimuth | Rotation Angle | Well inclination | Well diameter |
principle | Micro resistor | navigation | 6 arms |
scope | 0.2-10,000ohm-m 0<Rt/Rm<20,000 | 0-360° | 0-360° | 0-90° | 6-21in |
Vertical resolution 90% | 0.2in | N/A | N/A | N/A | N/A |
Detection depth | Determined by structure Within 12in | N/A | N/A | N/A | N/A |
Resolution | N/A | 0.1° | 0.1° | 0.03° | 0.1 in |
Accuracy | N/A | ±5° | ±2° | ±0.6° | ±0.1 in |
Main curve | Imaging images | AZI, HAZI | ROT | DEVI | CAL 1-6 |
Auxiliary curve | Micro resistivity, azimuth, rotation angle, AZI, well deviation |
Calibration |
Shop calibration: resistivity calibration box, navigator calibration table, 7in and 15in hole rings Field calibration: resistivity calibration box, navigation Sonde workion check, 7in hole ring |
Physical parameters |
hardware | tension | Compression force | Torque |
Tool connector | 130,000 lbs | 130,000 lbs | 600 lb -ft |
Spindle body | 130,000 lbs | 130,000 lbs | 600 lb -ft |
4 1/4-inch insulation sub | 130,000 lbs | 130,000 lbs | 600 lb -ft |
The real-time image data produced at the wellsite will go through a series of post-processing and image enhancement. The micro-resistivity image represents the borehole wall formation resistivity hetero-feature changes, in which the change of resistivity reflects variation of the lithology, porosity and mud content. The fluid nature in the alluvion and the irregular borehole wall will have certain impact on the image.
Application of MRIT images in geological analysis mainly includes the following.
Fracture identification and evaluation
Thin bed evaluation
Detailed stratigraphic and sedimentological analysis
Secondary porosity analysis and geological structure interpretation
Core restoring and lithology characterization assistance
The figure below shows MRIT images after post-processing wellsite raw data, in which the fracture bisecting the borehole along a north to south trend and the sand-shale boundary is clearly seen.
